| |

Decarburization Depth
The Decarburization Depth Materials Extension can detect sample boundaries and calculate the profile depth. The software determines the depth of both total and partial decarburization, according to the relative amount of free ferrite with increasing distance from the surface. The depth at one or more given degrees of decarburization can be entered directly into the results spreadsheet.
|
|
|
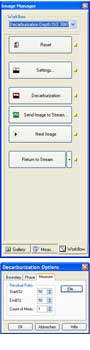 |
Settings
To accurately measure the total and partial decarburization, based on the relative amount of free ferrite, a number of settings are required for successful measurement. The user is initially prompted to define the boundary of the steel sample, followed by the areas in the steel that belong to the carbon deficient phase. Finally, the user is able to define at which residual ratios the decarburisation depth should be determined by setting a start and end residual ratio, along with the number of measurements. |
|
Execution
Based on these settings, the Decarburization Depth Materials Extension uses the cross-section of the steel to determine the residual decarburization ratio at various depths. Therefore the user simply has to click the ‘Decarburization’ icon to begin the analysis. The residual decarburization ratio is calibrated in such a way that it has a value of 100% on the sample surface and 0% at the depth where the decarburization ends. From this data, the software automatically calculates the decarburizationdepth at the predetermined residual ratios. |
|
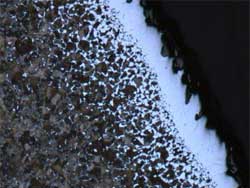
Results
All of the calculated decarburization depths will be displayed in a clear and easytoread table. In the image overlay, at least two lines will be drawn: a white line to demarcate what the system has detected to be the steel sample boundary and a blue line to represent each of the residual ratios specified by the user. The mean distance between these two lines is calculated as the corresponding decarburization depth. |
|
| |
 Determination of the depth of both total and partial decarburization
 Display of results as a spreadsheet