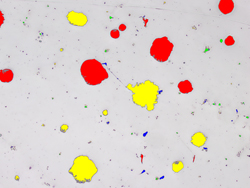
 |
Settings Both techniques are available by selecting the ‘Graphite Fraction’ icon. The first method requires the user to input the graphite content, if available from other measurements. The second technique uses the graphite content measured from the analysis of spherical graphite. Before the analysis begins, the user must select accurate thresholds so as the lighter coloured ferrite components are easily identifiable from the darker graphite/pearlite phase. |
|
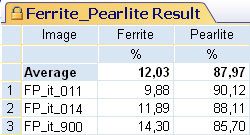
| Execution Ferrite/pearlite analysis is initiated with the simple click of the “Ferrite/Pearlite” icon. The ratio is then automatically determined and transferred into the results spreadsheet. As with the spherical graphite, measurements can be accumulated for multiple samples and subsequently reported in a single datasheet. To analyse any further images, the user simply needs to click on the ‘Next Image’ icon. |
Result
|
|

 Display of results as an overlay to the image and as a spreadsheet
